EMA 50/200 Pullback + RSI (BTC/USDT 15m - 2 Bar Logic)I recognize that combining indicators requires clear justification on how the components interact Therefore the new scripts description will explicitly detail the strategys operational logic
Objective The strategy is a Trend Following Pullback System designed for high frequency time frames 15m
Synergy The EMA50 EMA200 defines the primary Trend Direction Trend Filter It then utilizes a 2 Bar Pullback Logic to find an entry point where the price has momentarily reversed against the trendline and the RSI 14 serves as a Momentum Filter RSI greater than 50 for Long RSI less than 50 for Short to minimize false signals
Cerca negli script per "the strat"

SP500 Session Gap Fade StrategySummary in one paragraph
SPX Session Gap Fade is an intraday gap fade strategy for index futures, designed around regular cash sessions on five minute charts. It helps you participate only when there is a full overnight or pre session gap and a valid intraday session window, instead of trading every open. The original part is the gap distance engine which anchors both stop and optional target to the previous session reference close at a configurable flat time, so every trade’s risk scales with the actual gap size rather than a fixed tick stop.
Scope and intent
• Markets. Primarily index futures such as ES, NQ, YM, and liquid index CFDs that exhibit overnight gaps and regular cash hours.
• Timeframes. Intraday timeframes from one minute to fifteen minutes. Default usage is five minute bars.
• Default demo used in the publication. Symbol CME:ES1! on a five minute chart.
• Purpose. Provide a simple, transparent way to trade opening gaps with a session anchored risk model and forced flat exit so you are not holding into the last part of the session.
• Limits. This is a strategy. Orders are simulated on standard candles only.
Originality and usefulness
• Unique concept or fusion. The core novelty is the combination of a strict “full gap” entry condition with a session anchored reference close and a gap distance based TP and SL engine. The stop and optional target are symmetric multiples of the actual gap distance from the previous session’s flat close, rather than fixed ticks.
• Failure mode it addresses. Fixed sized stops do not scale when gaps are unusually small or unusually large, which can either under risk or over risk the account. The session flat logic also reduces the chance of holding residual positions into late session liquidity and news.
• Testability. All key pieces are explicit in the Inputs: session window, minutes before session end, whether to use gap exits, whether TP or SL are active, and whether to allow candle based closes and forced flat. You can toggle each component and see how it changes entries and exits.
• Portable yardstick. The main unit is the absolute price gap between the entry bar open and the previous session reference close. tp_mult and sl_mult are multiples of that gap, which makes the risk model portable across contracts and volatility regimes.
Method overview in plain language
The strategy first defines a trading session using exchange time, for example 08:30 to 15:30 for ES day hours. It also defines a “flat” time a fixed number of minutes before session end. At the flat bar, any open position is closed and the bar’s close price is stored as the reference close for the next session. Inside the session, the strategy looks for a full gap bar relative to the prior bar: a gap down where today’s high is below yesterday’s low, or a gap up where today’s low is above yesterday’s high. A full gap down generates a long entry; a full gap up generates a short entry. If the gap risk engine is enabled and a valid reference close exists, the strategy measures the distance between the entry bar open and that reference close. It then sets a stop and optional target as configurable multiples of that gap distance and manages them with strategy.exit. Additional exits can be triggered by a candle color flip or by the forced flat time.
Base measures
• Range basis. The main unit is the absolute difference between the current entry bar open and the stored reference close from the previous session flat bar. That value is used as a “gap unit” and scaled by tp_mult and sl_mult to build the target and stop.
Components
• Component one: Gap Direction. Detects full gap up or full gap down by comparing the current high and low to the previous bar’s high and low. Gap down signals a long fade, gap up signals a short fade. There is no smoothing; it is a strict structural condition.
• Component two: Session Window. Only allows entries when the current time is within the configured session window. It also defines a flat time before the session end where positions are forced flat and the reference close is updated.
• Component three: Gap Distance Risk Engine. Computes the absolute distance between the entry open and the stored reference close. The stop and optional target are placed as entry ± gap_distance × multiplier so that risk scales with gap size.
• Optional component: Candle Exit. If enabled, a bullish bar closes short positions and a bearish bar closes long positions, which can shorten holding time when price reverses quickly inside the session.
• Session windows. Session logic uses the exchange time of the chart symbol. When changing symbols or venues, verify that the session time string still matches the new instrument’s cash hours.
Fusion rule
All gates are hard conditions rather than weighted scores. A trade can only open if the session window is active and the full gap condition is true. The gap distance engine only activates if a valid reference close exists and use_gap_risk is on. TP and SL are controlled by separate booleans so you can use SL only, TP only, or both. Long and short are symmetric by construction: long trades fade full gap downs, short trades fade full gap ups with mirrored TP and SL logic.
Signal rule
• Long entry. Inside the active session, when the current bar shows a full gap down relative to the previous bar (current high below prior low), the strategy opens a long position. If the gap risk engine is active, it places a gap based stop below the entry and an optional target above it.
• Short entry. Inside the active session, when the current bar shows a full gap up relative to the previous bar (current low above prior high), the strategy opens a short position. If the gap risk engine is active, it places a gap based stop above the entry and an optional target below it.
• Forced flat. At the configured flat time before session end, any open position is closed and the close price of that bar becomes the new reference close for the following session.
• Candle based exit. If enabled, a bearish bar closes longs, and a bullish bar closes shorts, regardless of where TP or SL sit, as long as a position is open.
What you will see on the chart
• Markers on entry bars. Standard strategy entry markers labeled “long” and “short” on the gap bars where trades open.
• Exit markers. Standard exit markers on bars where either the gap stop or target are hit, or where a candle exit or forced flat close occurs. Exit IDs “long_gap” and “short_gap” label gap based exits.
• Reference levels. Horizontal lines for the current long TP, long SL, short TP, and short SL while a position is open and the gap engine is enabled. They update when a new trade opens and disappear when flat.
• Session background. This version does not add background shading for the session; session logic runs internally based on time.
• No on chart table. All decisions are visible through orders and exit levels. Use the Strategy Tester for performance metrics.
Inputs with guidance
Session Settings
• Trading session (sess). Session window in exchange time. Typical value uses the regular cash session for each contract, for example “0830-1530” for ES. Adjust if your broker or symbol uses different hours.
• Minutes before session end to force exit (flat_before_min). Minutes before the session end where positions are forced flat and the reference close is stored. Typical range is 15 to 120. Raising it closes trades earlier in the day; lowering it allows trades later in the session.
Gap Risk
• Enable gap based TP/SL (use_gap_risk). Master switch for the gap distance exit engine. Turning it off keeps entries and forced flat logic but removes automatic TP and SL placement.
• Use TP limit from gap (use_gap_tp). Enables gap based profit targets. Typical values are true for structured exits or false if you want to manage exits manually and only keep a stop.
• Use SL stop from gap (use_gap_sl). Enables gap based stop losses. This should normally remain true so that each trade has a defined initial risk in ticks.
• TP multiplier of gap distance (tp_mult). Multiplier applied to the gap distance for the target. Typical range is 0.5 to 2.0. Raising it places the target further away and reduces hit frequency.
• SL multiplier of gap distance (sl_mult). Multiplier applied to the gap distance for the stop. Typical range is 0.5 to 2.0. Raising it widens the stop and increases risk per trade; lowering it tightens the stop and may increase the number of small losses.
Exit Controls
• Exit with candle logic (use_candle_exit). If true, closes shorts on bullish candles and longs on bearish candles. Useful when you want to react to intraday reversal bars even if TP or SL have not been reached.
• Force flat before session end (use_forced_flat). If true, guarantees you are flat by the configured flat time and updates the reference close. Turn this off only if you understand the impact on overnight risk.
Filters
There is no separate trend or volatility filter in this version. All trades depend on the presence of a full gap bar inside the session. If you need extra filtering such as ATR, volume, or higher timeframe bias, they should be added explicitly and documented in your own fork.
Usage recipes
Intraday conservative gap fade
• Timeframe. Five minute chart on ES regular session.
• Gap risk. use_gap_risk = true, use_gap_tp = true, use_gap_sl = true.
• Multipliers. tp_mult around 0.7 to 1.0 and sl_mult around 1.0.
• Exits. use_candle_exit = false, use_forced_flat = true. Focus on the structured TP and SL around the gap.
Intraday aggressive gap fade
• Timeframe. Five minute chart.
• Gap risk. use_gap_risk = true, use_gap_tp = false, use_gap_sl = true.
• Multipliers. sl_mult around 0.7 to 1.0.
• Exits. use_candle_exit = true, use_forced_flat = true. Entries fade full gaps, stops are tight, and candle color flips flatten trades early.
Higher timeframe gap tests
• Timeframe. Fifteen minute or sixty minute charts on instruments with regular gaps.
• Gap risk. Keep use_gap_risk = true. Consider slightly higher sl_mult if gaps are structurally wider on the higher timeframe.
• Note. Expect fewer trades and be careful with sample size; multi year data is recommended.
Properties visible in this publication
• On average our risk for each position over the last 200 trades is 0.4% with a max intraday loss of 1.5% of the total equity in this case of 100k $ with 1 contract ES. For other assets, recalculations and customizations has to be applied.
• Initial capital. 100 000.
• Base currency. USD.
• Default order size method. Fixed with size 1 contract.
• Pyramiding. 0.
• Commission. Flat 2 USD per order in the Strategy Tester Properties. (2$ buying + 2$selling)
• Slippage. One tick in the Strategy Tester Properties.
• Process orders on close. ON.
Realism and responsible publication
• No performance claims are made. Past results do not guarantee future outcomes.
• Costs use a realistic flat commission and one tick of slippage per trade for ES class futures.
• Default sizing with one contract on a 100 000 reference account targets modest per trade risk. In practice, extreme slippage or gap through events can exceed this, so treat the one and a half percent risk target as a design goal, not a guarantee.
• All orders are simulated on standard candles. Shapes can move while a bar is forming and settle on bar close.
Honest limitations and failure modes
• Economic releases, thin liquidity, and limit conditions can break the assumptions behind the simple gap model and lead to slippage or skipped fills.
• Symbols with very frequent or very large gaps may require adjusted multipliers or alternative risk handling, especially in high volatility regimes.
• Very quiet periods without clean gaps will produce few or no trades. This is expected behavior, not a bug.
• Session windows follow the exchange time of the chart. Always confirm that the configured session matches the symbol.
• When both the stop and target lie inside the same bar’s range, the TradingView engine decides which is hit first based on its internal intrabar assumptions. Without bar magnifier, tie handling is approximate.
Legal
Education and research only. This strategy is not investment advice. You remain responsible for all trading decisions. Always test on historical data and in simulation with realistic costs before considering any live use.

XAutoTrade Alert Builder v1.1Automate Your NinjaTrader Trading with TradingView Alerts
The XAutoTrade Alert Builder is a flexible Pine Script strategy that bridges TradingView alerts with
NinjaTrader automated trading. Design custom entry signals, configure exit strategies, and execute trades
automatically on your NinjaTrader account - all from TradingView charts.
Key Features
📊 Flexible Signal Logic
- Configure buy/sell signals independently
- Compare any two indicators or price sources using crossover, crossunder, greater than, or less than
logic
- Visual buy/sell markers on chart for easy signal verification
🎯 Multiple Exit Methods
1. ATM Strategy - Leverage your existing NinjaTrader ATM templates for advanced order management
2. Source Signals - Exit positions based on opposite entry signals
3. Fixed Levels - Set stop loss and profit targets using ticks or percentage
⚙️ NinjaTrader Integration
- Direct webhook integration with XAutoTrade backend service
- Multi-account support (trade multiple accounts simultaneously)
- Position sizing and max position limits
- Market or limit order types with configurable offset
- Time-in-force options (DAY/GTC)
- Active hours filter (US ET timezone) to control when alerts execute
🔐 Secure & Reliable
- Webhook secret authentication
- Symbol override capability
- Real-time status indicator showing configuration readiness
How It Works
1. Configure Entry Signals - Choose your buy/sell logic by comparing any two data sources (price,
indicators, etc.)
2. Set Exit Strategy - Select ATM templates, signal-based exits, or fixed stop/profit levels
3. Connect to NinjaTrader - Enter your XAutoTrade webhook secret and account details
4. Create Alert - Use the strategy's alert system to send formatted JSON payloads to your XAutoTrade
webhook
5. Trade Futures & Stocks Automatically - TradingView alerts trigger real trades in your NinjaTrader account
Perfect For
- Traders wanting to automate TradingView strategies in NinjaTrader
- Users with existing ATM templates who want TradingView signal automation
- Multi-account traders managing several NinjaTrader accounts
- Anyone seeking a no-code bridge between TradingView and NinjaTrader
Requirements
- Active XAutoTrade account and subscription
- NinjaTrader 8 with XAutoTrade AddOn installed
- TradingView Premium/Pro account (for webhook alerts)

SRD
SRD v11 - Multi-Timeframe Volume Profile (POC, VAH, VAL)
Key Features
Dual Timeframe Analysis:
📈 Main Analysis (Daily): Calculates and displays the most significant levels based on a user-defined period of daily bars. This is ideal for identifying intraday and short-term trading opportunities.
📊 Strategic Analysis (Weekly): Plots key levels from a weekly perspective, giving you a broader, long-term view of market sentiment and structure. This can be toggled on or off.
Volume Profile Core Levels: The indicator automatically calculates and visualizes the three most important levels derived from volume analysis for both timeframes:
🎯 POC (Point of Control): The price level with the highest traded volume for the specified period. It acts as a powerful magnet for price and a key reference for market equilibrium.
🔴 VAH (Value Area High): The highest price level within the "Value Area" (where ~70% of the volume was traded). It often acts as a significant resistance zone.
🟢 VAL (Value Area Low): The lowest price level within the Value Area. It often serves as a strong support zone.
🟠 24-Hour High: An optional feature that plots the highest price reached in the last 24 hours, providing a crucial reference point for breakout and reversal traders.
Dynamic and Non-Repainting: The levels are calculated based on historical confirmed bars and update automatically as new periods (daily or weekly) close. The lines extend to the right, remaining relevant until a new calculation period begins.
Integrated Alert System: Never miss a key price interaction. The indicator includes a comprehensive alert system for:
Breakouts: Triggers when the price crosses above or below the POC, VAH, or VAL.
Touches: Triggers when the price touches one of these key levels without breaking through it (within a small tolerance).
Unified Alert: A single alert that notifies you of any of the above conditions.
Customization
The SRD v11 is fully customizable to fit your trading style. You can adjust:
Timeframes: Change the base timeframes for both the main (default Daily) and strategic (default Weekly) analysis.
Analysis Periods: Define the number of bars (days or weeks) to include in the Volume Profile calculation.
Visuals: Customize the color, width, and style (solid, dashed, dotted) of every line and label for clear and intuitive visualization.
Toggle Elements: Easily show or hide the strategic (weekly) analysis and the 24-hour high line.
How to Use It >
Identify Key Zones: Use the VAH (resistance) and VAL (support) lines to identify potential entry and exit zones. The area between VAH and VAL is the "Value Area," where the market has found acceptance.
Monitor the POC: The Point of Control is the ultimate level of equilibrium. Watch for price reactions around the POC. A sustained break above or below can signal a new trend.
Combine Timeframes: Use the strategic (weekly) levels as major, long-term points of interest and the main (daily) levels for your day-to-day trading setup. Confluence between levels from different timeframes can indicate extremely strong support or resistance.
Set Alerts: Configure alerts for breakouts or touches to be notified of critical market movements in real-time, even when you are away from the charts.

Low and Preceding High (Breakout + Bullis fgv + Extending Fib)🚀 Last Low & Preceding High: Bullish Reversal Strategy
This indicator identifies high-probability long setups by confirming a Bullish Market Structure Shift (BMS) coupled with a strong momentum filter.
🧠 Indicator Logic (How It Works)
The core function of this tool is to automatically locate the key structural points that lead to a bullish bias:
Structure Identification: It first defines a Range between the two most recent Pivot Lows. Within this range, it finds the Preceding High (the highest close before the current low) and the true Low Anchor (the lowest low/tail of the pivot low).
Breakout and Momentum Filter: A valid signal requires two conditions to be met on the current bar:
Bullish Breakout: The price must close above the Preceding High.
Marubozu Confirmation: A strong Bullish Marubozu candle (minimal wicks) must be present in the impulse move from the low, filtering for institutional strength.
Fibonacci Discount Zones: Upon confirmation, the indicator calculates and plots the discount zones (0.50, 0.618, 0.786) using the true extremes (tail-to-tail anchors). These zones start extending from the breakout candle and represent high-value areas for potential entries.
🎯 Entry and Risk Management
The strategy provides clear rules for execution once the logic is confirmed:
Entry Execution:
Wait for Retracement: Enter a Long position when the price retraces back into the colored Discount Zones (0.50 to 0.786).
Risk Control:
🛑 Stop Loss (SL): Placed below the Low Line (the swing low that initiated the move).
✅ Take Profit (TP): Placed above the High Line (the high that was broken).
Final note
"Special thanks to Mr. Mazen (@dr0chart) for developing this strategy."

Tristan's Tri-band StrategyTristan's Tri-band Strategy - Confluence Trading System
Strategy Overview:
This strategy combines three powerful technical indicators - RSI, Williams %R, and Bollinger Bands - into a single visual trading system. Instead of cluttering your chart with separate indicator panels, all signals are displayed directly on the price chart using color-coded gradient overlays, making it easy to spot high-probability trade setups at a glance.
How It Works:
The strategy identifies trading opportunities when multiple indicators align (confluence), suggesting strong momentum shifts:
📈 Long Entry Signals:
RSI drops to 30 or below (oversold)
Williams %R reaches -80 to -100 range (oversold)
Price touches or breaks below the lower Bollinger Band
All three conditions must align during your selected trading session
📉 Short Entry Signals:
RSI rises to 70 or above (overbought)
Williams %R reaches 0 to -20 range (overbought)
Price touches or breaks above the upper Bollinger Band
All three conditions must align during your selected trading session
Visual Indicators:
(faint) Green gradients below candles = Bullish oversold conditions (buying opportunity)
(faint) Red/Orange gradients above candles = Bearish overbought conditions (selling opportunity)
Stacked/brighter gradients = Multiple indicators confirming the same signal (higher probability) will stack and show brighter / less faint
Blue Bollinger Bands = Volatility boundaries and mean reversion zones
Exit Strategy:
Long trades exit when price reaches the upper Bollinger Band OR RSI becomes overbought (≥70)
Short trades exit when price reaches the lower Bollinger Band OR RSI becomes oversold (≤30)
Key Features:
✅ Session Filters - Trade only during NY (9:30 AM-4 PM), London (3 AM-11:30 AM), or Asia (7 PM-1 AM EST) sessions
✅ No Repainting - Signals are confirmed on candle close for realistic backtesting and live trading
✅ Customizable Parameters - Adjust RSI levels, BB standard deviations, Williams %R periods, and gradient visibility
✅ Visual Clarity - See all three indicators at once without switching between panels
✅ Built-in Alerts - Get notified when entry and exit conditions are met
How to Use Effectively:
Choose Your Trading Session - For day trading US stocks, enable only the NY session. For forex or 24-hour markets, select the sessions that match your schedule.
Look for Gradient Stacking - The brightest, most visible gradients occur when both RSI and Williams %R signal together. These are your highest-probability setups.
Confirm with Price Action - Wait for the candle to close before entering. The strategy enters on the next bar's open to prevent repainting.
Respect the Bollinger Bands - Entries occur at the outer bands (price extremes), and exits occur at the opposite band or when momentum reverses.
Backtest First - Test the strategy on your preferred instruments and timeframes. Works best on liquid assets with clear trends and mean reversion patterns (stocks, major forex pairs, indices).
Adjust Gradient Visibility - Use the "Gradient Strength" slider (lower = more visible) to make signals stand out on your chart style.
Best Timeframes: 5-minute to 1-hour charts for intraday trading; 4-hour to daily for swing trading (I have also found the 3 hour timeframe to work really well for some stocks / ETFs.)
Best Markets: Liquid instruments with volatility - SPY, QQQ, major stocks, EUR/USD, GBP/USD, major indices
Risk Management: This is a mean reversion strategy that works best in ranging or choppy markets. In strong trends, signals may appear less frequently. Always use proper position sizing and stop losses based on your risk tolerance.
----------------------------------------------
Note: Past performance does not guarantee future results. This strategy is provided for educational purposes. Always backtest thoroughly and practice proper risk management before live trading.RetryClaude can make mistakes. Please double-check responses. Sonnet 4.5

Buy&Hold Profitcalculator in EuroTitle: Buy & Hold Strategy in Euro
Description:
This Pine Script implements a simple yet flexible Buy & Hold strategy denominated in Euros, suitable for a wide range of assets including cryptocurrencies, forex pairs, and stocks.
Key Features:
Custom Investment Amount: Define your invested capital in Euros.
Flexible Start & End Dates: Specify exact entry and exit dates for the strategy.
Automatic Currency Conversion: Supports assets priced in USD or USDT, converting the invested capital to chart currency using the EUR/USD exchange rate.
Single Entry and Exit: Executes a one-time Buy & Hold position based on the defined timeframe.
Profit and Performance Tracking: Calculates total profit/loss in Euros and percentage returns.
Smart Exit Label: Displays a dynamic label at the exit showing final position value, net profit/loss, and return percentage. The label automatically adjusts its position above or below the price bar for optimal visibility.
Visual Enhancements:
Position value and profit/loss plotted on the chart.
Background color highlights the active investment period.
Buy and Sell markers clearly indicate entry and exit points.
This strategy is ideal for traders and investors looking to simulate long-term positions and evaluate performance in Euro terms, even when trading USD-denominated assets.
Usage Notes:
Best used on daily charts for medium- to long-term analysis.
Adjust start and end dates, as well as invested capital, to simulate different scenarios.
Works with any asset, but currency conversion is optimized for USD or USDT-pegged instruments.

v2.0—Tristan's Multi-Indicator Reversal Strategy🎯 Multi-Indicator Reversal Strategy - Optimized for High Win Rates
A powerful confluence-based strategy that combines RSI, MACD, Williams %R, Bollinger Bands, and Volume analysis to identify high-probability reversal points . Designed to let winners run with no stop loss or take profit - positions close only when opposite signals occur.
Also, the 3 hour timeframe works VERY well—just a lot less trades.
📈 Proven Performance
This strategy has been backtested and optimized on multiple blue-chip stocks with 80-90%+ win rates on 1-hour timeframes from Aug 2025 through Oct 2025:
✅ V (Visa) - Payment processor
✅ MSFT (Microsoft) - Large-cap tech
✅ WMT (Walmart) - Retail leader
✅ IWM (Russell 2000 ETF) - Small-cap index
✅ NOW (ServiceNow) - Enterprise software
✅ WM (Waste Management) - Industrial services
These stocks tend to mean-revert at extremes, making them ideal candidates for this reversal-based approach. I only list these as a way to show you the performance of the script. These values and stock choices may change over time as the market shifts. Keep testing!
🔑 How to Use This Strategy Successfully
Step 1: Apply to Chart
Open your desired stock (V, MSFT, WMT, IWM, NOW, WM recommended)
Set timeframe to 1 Hour
Apply this strategy
Check that the Williams %R is set to -20 and -80, and "Flip All Signals" is OFF (can flip this for some stocks to perform better.)
Step 2: Understand the Signals
🟢 Green Triangle (BUY) Below Candle:
Multiple indicators (RSI, Williams %R, MACD, Bollinger Bands) show oversold conditions
Enter LONG position
Strategy will pyramid up to 10 entries if more buy signals occur
Hold until red triangle appears
🔴 Red Triangle (SELL) Above Candle:
Multiple indicators show overbought conditions
Enter SHORT position (or close existing long)
Strategy will pyramid up to 10 entries if more sell signals occur
Hold until green triangle appears
🟣 Purple Labels (EXIT):
Shows when positions close
Displays count if multiple entries were pyramided (e.g., "Exit Long x5")
Step 3: Let the Strategy Work
Key Success Principles:
✅ Be Patient - Signals don't occur every day, wait for quality setups
✅ Trust the Process - Don't manually close positions, let opposite signals exit
✅ Watch Pyramiding - The strategy can add up to 10 positions in the same direction
✅ No Stop Loss - Positions ride through drawdowns until reversal confirmed
✅ Session Filter - Only trades during NY session (9:30 AM - 4:00 PM ET)
⚙️ Winning Settings (Already Set as Defaults)
INDICATOR SETTINGS:
- RSI Length: 14
- RSI Overbought: 70
- RSI Oversold: 30
- MACD: 12, 26, 9 (standard)
- Williams %R Length: 14
- Williams %R Overbought: -20 ⭐ (check this! And adjust to your liking)
- Williams %R Oversold: -80 ⭐ (check this! And adjust to your liking)
- Bollinger Bands: 20, 2.0
- Volume MA: 20 periods
- Volume Multiplier: 1.5x
SIGNAL REQUIREMENTS:
- Min Indicators Aligned: 2
- Require Divergence: OFF
- Require Volume Spike: OFF
- Require Reversal Candle: OFF
- Flip All Signals: OFF ⭐
RISK MANAGEMENT:
- Use Stop Loss: OFF ⭐⭐⭐
- Use Take Profit: OFF ⭐⭐⭐
- Allow Pyramiding: ON ⭐⭐⭐
- Max Pyramid Entries: 10 ⭐⭐⭐
SESSION FILTER:
- Trade Only NY Session: ON
- NY Session: 9:30 AM - 4:00 PM ET
**⭐ = Critical settings for success**
## 🎓 Strategy Logic Explained
### **How It Works:**
1. **Multi-Indicator Confluence**: Waits for at least 2 out of 4 technical indicators to align before generating signals
2. **Oversold = Buy**: When RSI < 30, Williams %R < -80, price below lower Bollinger Band, and/or MACD turning bullish → BUY signal
3. **Overbought = Sell**: When RSI > 70, Williams %R > -20, price above upper Bollinger Band, and/or MACD turning bearish → SELL signal
4. **Pyramiding Power**: As trend continues and more signals fire in the same direction, adds up to 10 positions to maximize gains
5. **Exit Only on Reversal**: No arbitrary stops or targets - only exits when opposite signal confirms trend change
6. **Session Filter**: Only trades during liquid NY session hours to avoid overnight gaps and low-volume periods
### **Why No Stop Loss Works:**
Traditional reversal strategies fail because they:
- Get stopped out too early during normal volatility
- Miss the actual reversal that happens later
- Cut winners short with tight take profits
This strategy succeeds because it:
- ✅ Rides through temporary noise
- ✅ Captures full reversal moves
- ✅ Uses multiple indicators for confirmation
- ✅ Pyramids into winning positions
- ✅ Only exits when technical picture completely reverses
---
## 📊 Understanding the Display
**Live Indicator Counter (Top Corner / end of current candles):**
Bull: 2/4
Bear: 0/4
(STANDARD)
Shows how many indicators currently align bullish/bearish
"STANDARD" = normal reversal mode (buy oversold, sell overbought)
"FLIPPED" = momentum mode if you toggle that setting
Visual Indicators:
🔵 Blue background = NY session active (trading window)
🟡 Yellow candle tint = Volume spike detected
💎 Aqua diamond = Bullish divergence (price vs RSI)
💎 Fuchsia diamond = Bearish divergence
⚡ Advanced Tips
Optimizing for Different Stocks:
If Win Rate is Low (<50%):
Try toggling "Flip All Signals" to ON (switches to momentum mode)
Increase "Min Indicators Aligned" to 3 or 4
Turn ON "Require Divergence"
Test on different timeframe (4-hour or daily)
If Too Few Signals:
Decrease "Min Indicators Aligned" to 2
Turn OFF all requirement filters
Widen Williams %R bands to -15 and -85
If Too Many False Signals:
Increase "Min Indicators Aligned" to 3 or 4
Turn ON "Require Divergence"
Turn ON "Require Volume Spike"
Reduce Max Pyramid Entries to 5
Stock Selection Guidelines:
Best Suited For:
Large-cap stable stocks (V, MSFT, WMT)
ETFs (IWM, SPY, QQQ)
Stocks with clear support/resistance
Mean-reverting instruments
Avoid:
Ultra low-volume penny stocks
Extremely volatile crypto (try traditional settings first)
Stocks in strong one-directional trends lasting months
🔄 The "Flip All Signals" Feature
If backtesting shows poor results on a particular stock, try toggling "Flip All Signals" to ON:
STANDARD Mode (OFF):
Buy when oversold (reversal strategy)
Sell when overbought
May work best for: V, MSFT, WMT, IWM, NOW, WM
FLIPPED Mode (ON):
Buy when overbought (momentum strategy)
Sell when oversold
May work best for: Strong trending stocks, momentum plays, crypto
Test both modes on your stock to see which performs better!
📱 Alert Setup
Create alerts to notify you of signals:
📊 Performance Expectations
With optimized settings on recommended stocks:
Typical results we are looking for:
Win Rate: 70-90%
Average Winner: 3-5%
Average Loser: 1-3%
Signals Per Week: 1-3 on 1-hour timeframe
Hold Time: Several hours to days
Remember: Past performance doesn't guarantee future results. Always use proper risk management.

Uptrick: Volume Weighted BandsIntroduction
This indicator, Uptrick: Volume Weighted Bands, overlays dynamic, volume-informed trend channels directly on the chart. By fusing price and volume data through volume-weighted and exponential moving averages, the script forms a core trend line with adaptive bandwidth controlled by volatility. It is designed to help traders identify trend direction, breakout entries, and extended conditions that may warrant take-profits or pullback re-entries.
Overview
The Volume Weighted Bands system is built around a trend line calculated by averaging a Volume Weighted Moving Average (VWMA) and an Exponential Moving Average (EMA), both over a configurable lookback period. This hybrid trend baseline is then smoothed further and expanded into dynamic upper and lower bands using an Average True Range (ATR) multiplier. These bands adapt with market volatility and shift color based on prevailing price action, helping traders quickly identify bullish, bearish, or neutral conditions.
Originality and Unique Features
This script introduces originality by blending both price and volume in the core trend calculation, a technique that is more responsive than traditional moving average bands. Its multi-mode visualization (cloud, single-band, or line-only), combined with selective buy/sell signals, makes it flexible for discretionary and algorithmic strategies alike. Optional modules for take-profit signals based on z-score deviation and RSI slope, as well as buy-back detection logic with cooldown filters, offer practical tools for managing trades beyond simple entries.
Explanation of Inputs
Every user input in this script is included to give the trader control over behavior and visual presentation:
Trend Length (len): Defines the lookback window for both the VWMA and EMA, controlling the sensitivity of the core trend baseline. A lower value makes the bands more reactive, while a higher value smooths out short-term noise.
Extra Smoothing (smoothLen): Applies an additional EMA to the blended VWMA/EMA average. This second-level smoothing ensures the central trend line reacts gradually to shifts in price.
Band Width (ATR Multiplier) (bandMult): Multiplies the ATR to create the width of the upper and lower bands around the trend line. Larger values widen the bands, capturing more volatility, while smaller values narrow them.
ATR Length (atrLen): Sets the length of the ATR used in calculating band width and signal offsets. Longer values produce smoother band boundaries.
Show Buy/Sell Signals (showSignals): Toggles the primary crossover/crossunder entry signals, which are labeled when the close crosses the upper or lower band.
Visual Mode (visualMode): Allows selection between three display modes:
--> Cloud: Shows both bands and the central trend line with a shaded background.
--> Single Band: Displays only the active (upper or lower) band depending on trend state, with gradient fill to price.
--> Line Only: Shows only the trend line for a minimal visual profile.
Take Profit Signals (enableTP): Enables a z-score-based profit-taking signal system. Signals occur when price deviates significantly from the trend line and RSI confirms exhaustion.
TP Z-Score Threshold (tpThreshold): Sets the z-score deviation required to trigger a take-profit signal. Higher values reduce the frequency of signals, focusing on more extreme moves.
Re-Entries (enableBuyBack): Enables logic to signal when price reverts into the band after an initial breakout, suggesting a possible re-entry or pullback setup.
Buy Back Cooldown (bars) (buyBackCooldown): Defines a minimum bar count before a new buy-back signal is allowed, preventing rapid retriggering in choppy conditions.
Buy Offset and Sell Offset: Hidden inputs used to vertically adjust the placement of the Buy ("𝓤𝓹") and Sell ("𝓓𝓸𝔀𝓷") labels relative to the bands. These use ATR units to maintain proportionality across different instruments and timeframes.
Take-Profit Signal Module
The take-profit module uses a z-score of the distance between price and the trend line to detect extended conditions. In bullish trends, a signal appears when price is well above the band and RSI indicates exhaustion; the opposite applies for bearish conditions. A boolean flag is used to prevent retriggering until RSI resets. These signals are plotted with minimalist “X” markers near recent highs or lows, based on whether the market is extended upward or downward.
Re-Entry Logic
The re-entry system identifies instances where price momentarily dips or spikes into the opposite band but closes back inside, implying a continuation of the prevailing trend. This module can be particularly useful for traders managing entries after brief pullbacks. A built-in cooldown period helps filter out noise and prevents signal overloading during fast markets. Visual markers are shown as upward or downward arrows near the relevant candle wicks.
How to Use This Indicator
The basic usage of this indicator follows a directional, signal-driven approach. When a buy signal appears, it suggests entering a long position. The recommended stop loss placement is below the lower band, allowing for some breathing space to accommodate natural volatility. As the position progresses, take partial profits—typically 10% to 15% of the position—each time a take-profit signal (marked with an "X") is shown on the chart.
An optional feature is the buy-back signal, which can be used to re-enter after partial exits or missed entries. Utilizing this can help reduce losses during false breakouts or trend reversals by scaling in more gradually. However, it also means that in strong, clean trends, the full position may not be captured from the start, potentially reducing the total return. It is up to the trader to decide whether to enter fully on the initial signal or incrementally using buy-backs.
When a sell signal appears, the strategy advises fully exiting any long positions and immediately switching to a short position. The short trade follows the same logic: place your stop loss above the upper band with some margin, and again, take partial profits at each take-profit signal.
Visual Presentation and Signal Labels
All signals are plotted with clean, minimal labels that avoid clutter, and are color-coded using a custom palette designed to remain clear across light and dark chart themes. Bullish trends are marked in teal and bearish trends in magenta. Candles and wicks are also colored accordingly to align price action with the detected trend state. Buy and sell entries are marked with "𝓤𝓹" and "𝓓𝓸𝔀𝓷" labels.
Summary
In summary, the Uptrick: Volume Weighted Bands indicator provides a versatile, visually adaptive trend and volatility tool that can serve multiple styles of trading. Through its integration of price, volume, and volatility, along with modular take-profit and buy-back signaling, it aims to provide actionable structure across a range of market conditions.
Disclaimer
This indicator is for educational purposes only. Trading involves risk, and past performance does not guarantee future results. Always test strategies before applying them in live markets.

Strat 3-Bar (Outside Bar) AlertThis indicator automatically detects and alerts you when a Strat 3-Bar (Outside Bar) forms on any chart or timeframe.
An Outside Bar (3) occurs when both sides of the previous candle’s range are taken out — the high breaks above the prior bar’s high AND the low breaks below its low. It signals expansion in price discovery and potential reversals or continuations.
📈 How to Use:
1. Add this script to your chart.
2. Look for red “3” labels or triangles above outside bars.
3. To get alerts, click the TradingView alert icon (⏰):
• Condition → Strat 3-Bar (Outside Bar) Alert
• Option → “Outside Bar (3) Detected”
• Choose “Once per bar close.”
💡 Pro Tips:
- Use with Strat Assist for visual context.
- Combine with timeframe continuity for directional bias.
- Great on 15-min, 1H, and Daily charts.
---
👩🏽💻 Shared with love by Yolanda
Inspired by community discussions with Jalen (ChatGPT)
Let’s keep building each other up and mastering The Strat together! 💛
TheStrat, outsidebar, 3bar, priceaction, tradingstrategy, alert, reversal, continuation, stratassist, strat, technicalanalysis, pinev6, smartmoney

Pullback Finder AutoPullback Finder Auto — Intraday Momentum Cooling Detector
Pullback Finder Auto is designed to find stocks that have made a strong intraday run from the open and are now cooling off while still positive — the classic pullback zone where continuation entries often form.
It automatically measures the percentage change from today’s open and highlights bars where:
the stock has already run at least a chosen amount (for example +10 % above its open), and
the current price is still up but within a defined pullback range (for example between +3 % and +8 % above the open).
When those two conditions are met, you’ll see green graphics on your chart:
Green triangle markers under the candle.
Optionally, small green PB labels such as “PB 5.2 %” showing the exact percentage from open when the setup occurs.
A green highlight in the sub‑window or line plot if you left the “Change from Open %” plot active.
These are your visual cues that a pullback has formed — a stock that previously ran and is now pulling back while holding strength.
How it works
The script continuously monitors:
• High % from Open = (high − open) / open × 100
• Current % from Open = (close − open) / open × 100
A “Pullback” condition triggers only if:
the high % is greater than or equal to your minimum run threshold, and
the current % sits between your minimum and maximum pullback percentages.
When both are true, the indicator plots the green triangle and optional label.
Default parameters
Min Run % = 10
Min Current % = 3
Max Current % = 8
Session Start = 09:30 – 16:00 US Eastern
All can be changed to fit different volatility levels.
Lower values catch smaller moves; higher values restrict signals to explosive runners.
Using it in real time
During live trading, Pullback Finder Auto updates with each candle.
When a bar first enters the target zone, a green triangle and PB label will appear immediately under that candle.
These are dynamic: if price moves out of the valid zone on the same bar, the marker may disappear.
You can create an alert on “Pullback Finder Auto – Pullback Candidate” to be notified whenever new triangles appear across your active symbols.
This works on any timeframe:
use shorter timeframes such as 1‑minute or 5‑minute charts for fast, intraday detection,
use longer timeframes for a broader view of the day’s market structure.
Using it on past data (scanning backwards)
When you scroll back through history, past green triangles remain visible at every bar where the condition was true at that time.
The PB labels next to those candles show exactly how far above the open the stock was trading during the historical setup.
Use this for visual back‑testing: study how price reacted after these pullback points, adjust the thresholds, and refine your criteria for different markets.
The grey or teal line under the chart (if enabled) shows the percent‑from‑open curve so you can see the full run‑and‑cool pattern leading into each triangle signal.
If you convert the indicator into a strategy, the same condition becomes historical entry points you can test with the Strategy Tester.
Summary
1. Pullback Finder Auto paints green triangles and PB labels whenever an intraday pullback fits your criteria.
2. It runs dynamically in real‑time and also preserves markers for historical review.
3. Adjust the thresholds to match volatility or timeframe.
4. Ideal for visual scanning, watchlist alerts, or integration into a lightweight screening strategy.

Adaptive Trend 1m ### Overview
The "Adaptive Trend Impulse Parallel SL/TP 1m Realistic" strategy is a sophisticated trading system designed specifically for high-volatility markets like cryptocurrencies on 1-minute timeframes. It combines trend-following with momentum filters and adaptive parameters to dynamically adjust to market conditions, ensuring more reliable entries and risk management. This strategy uses SuperTrend for primary trend detection, enhanced by MACD, RSI, Bollinger Bands, and optional volume spikes. It incorporates parallel stop-loss (SL) and multiple take-profit (TP) levels based on ATR, with options for breakeven and trailing stops after the first TP. Optimized for realistic backtesting on short timeframes, it avoids over-optimization by adapting indicators to market speed and efficiency.
### Principles of Operation
The strategy operates on the principle of adaptive impulse trading, where entry signals are generated only when multiple conditions align to confirm a strong trend reversal or continuation:
1. **Trend Detection (SuperTrend)**: The core signal comes from an adaptive SuperTrend indicator. It calculates upper and lower bands using ATR (Average True Range) with dynamic periods and multipliers. A buy signal occurs when the price crosses above the lower band (from a downtrend), and a sell signal when it crosses below the upper band (from an uptrend). Adaptation is based on Rate of Change (ROC) to measure market speed, shortening periods in fast markets for quicker responses.
2. **Momentum and Trend Filters**:
- **MACD**: Uses adaptive fast and slow lengths. In "Trend Filter" mode (default when "Use MACD Cross" is false), it checks if the MACD line is above/below the signal for long/short. In cross mode, it requires a crossover/crossunder.
- **RSI**: Adaptive period RSI must be above 50 for longs and below 50 for shorts, confirming overbought/oversold conditions dynamically.
- **Bollinger Bands (BB)**: Depending on the mode ("Midline" by default), it requires the price to be above/below the BB midline for longs/shorts, or a breakout in "Breakout" mode. Deviation adapts to market efficiency.
- **Volume Spike Filter** (optional): Entries require volume to exceed an adaptive multiple of its SMA, signaling strong impulse.
3. **Volatility Filter**: Entries are only allowed if current ATR percentage exceeds a historical minimum (adaptive), preventing trades in low-volatility ranges.
4. **Risk Management (Parallel SL/TP)**:
- **Stop-Loss**: Set at an adaptive ATR multiple below/above entry for long/short.
- **Take-Profits**: Three levels at adaptive ATR multiples, with partial position closures (e.g., 51% at TP1, 25% at TP2, remainder at TP3).
- **Post-TP1 Features**: Optional breakeven moves SL to entry after TP1. Trailing SL uses BB midline as a dynamic trail.
- All levels are calculated per trade using the ATR at entry, making them "realistic" for 1m charts by widening SL and tightening initial TPs.
The strategy enters long on buy signals with all filters met, and short on sell signals. It uses pyramid margin (100% long/short) for full position sizing.
Adaptation is driven by:
- **Market Speed (normSpeed)**: Based on ROC, tightens multipliers in volatile periods.
- **Efficiency Ratio (ER)**: Measures trend strength, adjusting periods for trending vs. ranging markets.
This ensures the strategy "adapts" without manual tweaks, reducing false signals in varying conditions.
### Main Advantages
- **Adaptability**: Unlike static strategies, parameters dynamically adjust to market volatility and trend strength, improving performance across ranging and trending phases without over-optimization.
- **Realistic Risk Management for 1m**: Wider SL and tiered TPs prevent premature stops in noisy short-term charts, while partial profits lock in gains early. Breakeven/trailing options protect profits in extended moves.
- **Multi-Filter Confirmation**: Combines trend, momentum, and volume for high-probability entries, reducing whipsaws. The volatility filter avoids flat markets.
- **Debug Visualization**: Built-in plots for signals, levels, and component checks (when "Show Debug" is enabled) help users verify logic on charts.
- **Efficiency**: Low computational load, suitable for real-time trading on TradingView with alerts.
Backtesting shows robust results on volatile assets, with a focus on sustainable risk (e.g., SL at 3x ATR avoids excessive drawdowns).
### Uniqueness
What sets this strategy apart is its **fully adaptive framework** integrating multiple indicators with real-time market metrics (ROC for speed, ER for efficiency). Most trend strategies use fixed parameters, leading to poor adaptation; here, every key input (periods, multipliers, deviations) scales dynamically within bounds, creating a "self-tuning" system. The "parallel SL/TP with 1m realism" adds custom handling for micro-timeframes: tightened initial TPs for quick wins and adaptive min-ATR filter to skip low-vol bars. Unlike generic mashups, it justifies the combination—SuperTrend for trend, MACD/RSI/BB for impulse confirmation, volume for conviction—working synergistically to capture "trend impulses" while filtering noise. The post-TP1 breakeven/trailing tied to BB adds a unique profit-locking mechanism not common in open-source scripts.
### Recommended Settings
These settings are optimized and recommended for trading ASTER/USDT on Bybit, with 1-minute chart, x10 leverage, and cross margin mode. They provide a balanced risk-reward for this volatile pair:
- **Base Inputs**:
- Base ATR Period: 10
- Base SuperTrend ATR Multiplier: 2.5
- Base MACD Fast: 8
- Base MACD Slow: 17
- Base MACD Signal: 6
- Base RSI Period: 9
- Base Bollinger Period: 12
- Bollinger Deviation: 1.8
- Base Volume SMA Period: 19
- Base Volume Spike Multiplier: 1.8
- Adaptation Window: 54
- ROC Length: 10
- **TP/SL Settings**:
- Use Stop Loss: True
- Base SL Multiplier (ATR): 3
- Use Take Profits: True
- Base TP1 Multiplier (ATR): 5.5
- Base TP2 Multiplier (ATR): 10.5
- Base TP3 Multiplier (ATR): 19
- TP1 % Position: 51
- TP2 % Position: 25
- Breakeven after TP1: False
- Trailing SL after TP1: False
- Base Min ATR Filter: 0.001
- Use Volume Spike Filter: True
- BB Condition: Midline
- Use MACD Cross (false=Trend Filter): True
- Show Debug: True
For backtesting, use initial capital of 30 USD, base currency USDT, order size 100 USDT, pyramiding 1, commission 0.1%, slippage 0 ticks, long/short margin 0%.
Always backtest on your platform and use risk management—risk no more than 1-2% per trade. This is not financial advice; trade at your own risk.

4-Hour Range Scalping [v6.3]User Guide: 4-Hour Range Scalping Strategy
Hello! Here is the guide for the Pine Script strategy. Please read it carefully to get the best results.
📈 This script automates the "4-Hour Range Scalping Strategy" from the video.
The main idea is that the first four hours of a major trading day (like New York) set up a "trap zone." The strategy waits for the price to break out of this zone and then fail, giving us a signal that the breakout was false and the price is likely to reverse.
Here’s the simple logic:
Define the Range: It precisely calculates the highest high and lowest low during the first four hours of the selected trading session (e.g., 00:00 to 04:00 New York Time).
Wait for a Breakout: It then monitors the 5-minute chart for a price breakout where a candle fully closes outside of this established range.
Identify the Reversal: The trade trigger occurs when the price fails to continue its breakout and a subsequent 5-minute candle closes back inside the range. This signals a potential reversal or "failed breakout."
Execute the Trade:
]A Short (Sell) trade is triggered after a failed breakout above the range high.
A Long (Buy) trade is triggered after a failed breakout below the range low.
Manage the Risk: The Stop Loss is automatically placed at the peak (for shorts) or trough (for longs) of the breakout move, and the Take Profit is set to a default 2:1 Risk/Reward Ratio.
How to Use the Script (Step-by-Step) ⚙️
Follow these instructions to get it running perfectly.
1. Set Your Chart Timeframe This is the most important step. The strategy is designed to run on a 5-minute (5m) chart. Open your TradingView chart and make sure the timeframe is set to "5m".
2. Add the Script to Your Chart Open the Pine Editor tab at the bottom of TradingView, paste the entire script, and click the "Add to chart" button.
3. Configure the Settings On your chart, find the strategy's name (e.g., "4-Hour Range Scalping ") and click the gear icon ⚙️ to open its settings.
Trading Session: Choose the session for the range. New York is the default and the one from the video.
Risk/Reward Ratio: The default is 2.0, meaning your potential profit is twice your potential loss. You can adjust this to test other targets.
Backtesting Period: To see how the strategy performed on all historical data, go to the "Strategy Tester" panel, click its own gear icon ⚙️, and uncheck the boxes for "Start Date" and "End Date."
4. Understand the Visuals on Your Chart
Blue Background Area: This is the 4-hour calculation window. The script is identifying the day's high and low during this time. No trades will ever happen here.
Red Line (Range High): The highest price of the 4-hour window. This is the upper boundary of the "trap zone."
Green Line (Range Low): The lowest price of the 4-hour window. This is the lower boundary.
Green Triangle (▲): Shows where a Long (Buy) trade was entered.
Red Triangle (▼): Shows where a Short (Sell) trade was entered.
A Very Important Note on Timezones 🕒
This is critical for you in the Philippines (PHT).
The script is based on the New York session, which is 12 hours behind you. Your TradingView chart will still show your local time, but the script works on NY time in the background.
The New York "day" begins at 12:00 PM (Noon) your time.
The script's blue calculation window will be from 12:00 PM to 4:00 PM your local time.
The red and green range lines will appear on your chart only after 4:00 PM your time.
So, if you look at your chart in the morning or early afternoon, you will not see today's range yet. This is normal! The script is just waiting for the New York session to start.
How to Set Up Trade Alerts 🔔
You can have TradingView send you a notification whenever the script enters a trade.
Click the "Alert" button (looks like a clock) in the right-hand toolbar of TradingView.
In the "Condition" dropdown, select the name of the script (e.g., "4-Hour Range Scalping...").
You will then see two options: "Long Signal" and "Short Signal".
Select one (e.g., "Long Signal") and configure how you want to be notified (e.g., "Notify on app").
Click "Create". Repeat the process to create an alert for the other signal.
⚠️ Important Disclosure
For Educational and Research Purposes Only.
This script and all accompanying information are provided for educational and research purposes only. The strategy demonstrated is a technical concept and should not be misconstrued as financial, investment, legal, or tax advice.
Trading financial markets involves substantial risk and is not suitable for every investor. There is a possibility that you could sustain a loss of some or all of your initial investment. Therefore, you should not invest money that you cannot afford to lose.
Past performance is not indicative of future results. The backtesting results shown by this script are historical and do not guarantee future performance. Market conditions are constantly changing.
By using this script, you acknowledge that you are solely responsible for any and all trading decisions you make. You should conduct your own thorough research and, if necessary, seek advice from an independent financial advisor before making any investment decisions. The creators of this script assume no liability for any of your trading results.

HermesHERMES STRATEGY - TRADINGVIEW DESCRIPTION
OVERVIEW
Hermes is an adaptive trend-following strategy that uses dual ALMA (Arnaud Legoux Moving Average) filters to identify high-quality entry and exit points. It's designed for swing and position traders who want smooth, low-lag signals with minimal whipsaws.
Unlike traditional moving averages that operate on price, Hermes analyzes price returns (percentage changes) to create signals that work consistently across any asset class and price range.
HOW IT WORKS
DUAL ALMA SYSTEM
The strategy uses two ALMA lines applied to price returns:
• Fast ALMA (Blue Line): Short-term trend signal (default: 80 periods)
• Slow ALMA (Black Line): Long-term baseline trend (default: 250 periods)
ALMA is superior to simple or exponential moving averages because it provides:
• Smoother curves with less noise
• Significantly reduced lag
• Natural resistance to outliers and flash crashes
TRADING LOGIC
BUY SIGNAL:
• Fast ALMA crosses above Slow ALMA (bullish regime)
• Price makes new N-bar high (momentum confirmation)
• Optional: Price above 200 EMA (macro trend filter)
• Optional: ALMA lines sufficiently separated (strength filter)
SELL SIGNAL:
• Fast ALMA crosses below Slow ALMA (bearish regime)
• Optional: Price makes new N-bar low (momentum confirmation)
The strategy stays in position during the entire bullish regime, allowing you to ride trends for weeks or months.
VISUAL INDICATORS
LINES:
• Blue Line: Fast ALMA (short-term signal)
• Black Line: Slow ALMA (long-term baseline)
TRADE MARKERS:
• Green Triangle Up: Buy executed
• Red Triangle Down: Sell executed
• Orange "M": Buy blocked by momentum filter
• Purple "W": Buy blocked by weak crossover strength
KEY PARAMETERS
ALMA SETTINGS:
• Short Period (default: 30) - Fast signal responsiveness
• Long Period (default: 250) - Baseline stability
• ALMA Offset (default: 0.90) - Balance between lag and smoothness
• ALMA Sigma (default: 7.5) - Gaussian curve width
ENTRY/EXIT FILTERS:
• Buy Lookback (default: 7) - Bars for momentum confirmation (required)
• Sell Lookback (default: 0) - Exit momentum bars (0 = disabled for faster exits)
• Min Crossover Strength (default: 0.0) - Required ALMA separation (0 = disabled)
• Use Macro Filter (default: true) - Only enter above 200 EMA
BEST PRACTICES
RECOMMENDED ASSETS - Works well on:
• Cryptocurrencies (Bitcoin, Ethereum, etc.)
• Major indices (S&P 500, Nasdaq)
• Large-cap stocks
• Commodities (Gold, Oil)
RECOMMENDED TIMEFRAMES:
• Daily: Primary timeframe for swing trading
• 4-Hour: More active trading (increase trade frequency)
• Weekly: Long-term position trading
PARAMETER TUNING:
• More trades: Lower Short Period (60-80)
• Fewer trades: Raise Short Period (100-120)
• Faster exits: Set Sell Lookback = 0
• Safer entries: Enable Macro Filter (Use Macro Filter = true)
STRATEGY ADVANTAGES
1. Low Lag - ALMA provides faster signals than traditional moving averages
2. Smooth Signals - Minimal whipsaws compared to crossover strategies
3. Asset Agnostic - Same parameters work across different markets
4. Trend Capture - Stays positioned during entire bullish regimes
5. Risk Management - Multiple filters prevent poor entries
6. Visual Clarity - Easy to interpret regime and filter states
WHEN TO USE HERMES
BEST FOR:
• Trending markets (crypto bull runs, equity uptrends)
• Swing trading (hold days to weeks)
• Position trading (hold weeks to months)
• Clear trend identification
• Risk-managed exposure
NOT SUITABLE FOR:
• Ranging/sideways markets
• Scalping or day trading
• High-frequency trading
• Mean reversion strategies
RISK DISCLAIMER
This indicator is for educational purposes only. Past performance does not guarantee future results. Always use proper position sizing and risk management. Test thoroughly on historical data before live trading.
CREDITS
Inspired by Giovanni Santostasi's Power Law Volatility Indicator, generalized for universal application across all assets using adaptive ALMA filtering.
Strategy by Hermes Trading Systems
QUICK START
1. Add indicator to chart
2. Use on daily timeframe for best results
3. Look for green buy signals when blue line crosses above black line
4. Exit on red sell signals when blue line crosses below black line
5. Adjust parameters based on your trading style:
• Conservative: Enable Macro Filter, increase Buy Lookback to 10
• Aggressive: Disable Macro Filter, lower Short Period to 60
• Default settings work well for most assets

Quantum Flux Universal Strategy Summary in one paragraph
Quantum Flux Universal is a regime switching strategy for stocks, ETFs, index futures, major FX pairs, and liquid crypto on intraday and swing timeframes. It helps you act only when the normalized core signal and its guide agree on direction. It is original because the engine fuses three adaptive drivers into the smoothing gains itself. Directional intensity is measured with binary entropy, path efficiency shapes trend quality, and a volatility squash preserves contrast. Add it to a clean chart, watch the polarity lane and background, and trade from positive or negative alignment. For conservative workflows use on bar close in the alert settings when you add alerts in a later version.
Scope and intent
• Markets. Large cap equities and ETFs. Index futures. Major FX pairs. Liquid crypto
• Timeframes. One minute to daily
• Default demo used in the publication. QQQ on one hour
• Purpose. Provide a robust and portable way to detect when momentum and confirmation align, while dampening chop and preserving turns
• Limits. This is a strategy. Orders are simulated on standard candles only
Originality and usefulness
• Unique concept or fusion. The novelty sits in the gain map. Instead of gating separate indicators, the model mixes three drivers into the adaptive gains that power two one pole filters. Directional entropy measures how one sided recent movement has been. Kaufman style path efficiency scores how direct the path has been. A volatility squash stabilizes step size. The drivers are blended into the gains with visible inputs for strength, windows, and clamps.
• What failure mode it addresses. False starts in chop and whipsaw after fast spikes. Efficiency and the squash reduce over reaction in noise.
• Testability. Every component has an input. You can lengthen or shorten each window and change the normalization mode. The polarity plot and background provide a direct readout of state.
• Portable yardstick. The core is normalized with three options. Z score, percent rank mapped to a symmetric range, and MAD based Z score. Clamp bounds define the effective unit so context transfers across symbols.
Method overview in plain language
The strategy computes two smoothed tracks from the chart price source. The fast track and the slow track use gains that are not fixed. Each gain is modulated by three drivers. A driver for directional intensity, a driver for path efficiency, and a driver for volatility. The difference between the fast and the slow tracks forms the raw flux. A small phase assist reduces lag by subtracting a portion of the delayed value. The flux is then normalized. A guide line is an EMA of a small lead on the flux. When the flux and its guide are both above zero, the polarity is positive. When both are below zero, the polarity is negative. Polarity changes create the trade direction.
Base measures
• Return basis. The step is the change in the chosen price source. Its absolute value feeds the volatility estimate. Mean absolute step over the window gives a stable scale.
• Efficiency basis. The ratio of net move to the sum of absolute step over the window gives a value between zero and one. High values mean trend quality. Low values mean chop.
• Intensity basis. The fraction of up moves over the window plugs into binary entropy. Intensity is one minus entropy, which maps to zero in uncertainty and one in very one sided moves.
Components
• Directional Intensity. Measures how one sided recent bars have been. Smoothed with RMA. More intensity increases the gain and makes the fast and slow tracks react sooner.
• Path Efficiency. Measures the straightness of the price path. A gamma input shapes the curve so you can make trend quality count more or less. Higher efficiency lifts the gain in clean trends.
• Volatility Squash. Normalizes the absolute step with Z score then pushes it through an arctangent squash. This caps the effect of spikes so they do not dominate the response.
• Normalizer. Three modes. Z score for familiar units, percent rank for a robust monotone map to a symmetric range, and MAD based Z for outlier resistance.
• Guide Line. EMA of the flux with a small lead term that counteracts lag without heavy overshoot.
Fusion rule
• Weighted sum of the three drivers with fixed weights visible in the code comments. Intensity has fifty percent weight. Efficiency thirty percent. Volatility twenty percent.
• The blend power input scales the driver mix. Zero means fixed spans. One means full driver control.
• Minimum and maximum gain clamps bound the adaptive gain. This protects stability in quiet or violent regimes.
Signal rule
• Long suggestion appears when flux and guide are both above zero. That sets polarity to plus one.
• Short suggestion appears when flux and guide are both below zero. That sets polarity to minus one.
• When polarity flips from plus to minus, the strategy closes any long and enters a short.
• When flux crosses above the guide, the strategy closes any short.
What you will see on the chart
• White polarity plot around the zero line
• A dotted reference line at zero named Zen
• Green background tint for positive polarity and red background tint for negative polarity
• Strategy long and short markers placed by the TradingView engine at entry and at close conditions
• No table in this version to keep the visual clean and portable
Inputs with guidance
Setup
• Price source. Default ohlc4. Stable for noisy symbols.
• Fast span. Typical range 6 to 24. Raising it slows the fast track and can reduce churn. Lowering it makes entries more reactive.
• Slow span. Typical range 20 to 60. Raising it lengthens the baseline horizon. Lowering it brings the slow track closer to price.
Logic
• Guide span. Typical range 4 to 12. A small guide smooths without eating turns.
• Blend power. Typical range 0.25 to 0.85. Raising it lets the drivers modulate gains more. Lowering it pushes behavior toward fixed EMA style smoothing.
• Vol window. Typical range 20 to 80. Larger values calm the volatility driver. Smaller values adapt faster in intraday work.
• Efficiency window. Typical range 10 to 60. Larger values focus on smoother trends. Smaller values react faster but accept more noise.
• Efficiency gamma. Typical range 0.8 to 2.0. Above one increases contrast between clean trends and chop. Below one flattens the curve.
• Min alpha multiplier. Typical range 0.30 to 0.80. Lower values increase smoothing when the mix is weak.
• Max alpha multiplier. Typical range 1.2 to 3.0. Higher values shorten smoothing when the mix is strong.
• Normalization window. Typical range 100 to 300. Larger values reduce drift in the baseline.
• Normalization mode. Z score, percent rank, or MAD Z. Use MAD Z for outlier heavy symbols.
• Clamp level. Typical range 2.0 to 4.0. Lower clamps reduce the influence of extreme runs.
Filters
• Efficiency filter is implicit in the gain map. Raising efficiency gamma and the efficiency window increases the preference for clean trends.
• Micro versus macro relation is handled by the fast and slow spans. Increase separation for swing, reduce for scalping.
• Location filter is not included in v1.0. If you need distance gates from a reference such as VWAP or a moving mean, add them before publication of a new version.
Alerts
• This version does not include alertcondition lines to keep the core minimal. If you prefer alerts, add names Long Polarity Up, Short Polarity Down, Exit Short on Flux Cross Up in a later version and select on bar close for conservative workflows.
Strategy has been currently adapted for the QQQ asset with 30/60min timeframe.
For other assets may require new optimization
Properties visible in this publication
• Initial capital 25000
• Base currency Default
• Default order size method percent of equity with value 5
• Pyramiding 1
• Commission 0.05 percent
• Slippage 10 ticks
• Process orders on close ON
• Bar magnifier ON
• Recalculate after order is filled OFF
• Calc on every tick OFF
Honest limitations and failure modes
• Past results do not guarantee future outcomes
• Economic releases, circuit breakers, and thin books can break the assumptions behind intensity and efficiency
• Gap heavy symbols may benefit from the MAD Z normalization
• Very quiet regimes can reduce signal contrast. Use longer windows or higher guide span to stabilize context
• Session time is the exchange time of the chart
• If both stop and target can be hit in one bar, tie handling would matter. This strategy has no fixed stops or targets. It uses polarity flips for exits. If you add stops later, declare the preference
Open source reuse and credits
• None beyond public domain building blocks and Pine built ins such as EMA, SMA, standard deviation, RMA, and percent rank
• Method and fusion are original in construction and disclosure
Legal
Education and research only. Not investment advice. You are responsible for your decisions. Test on historical data and in simulation before any live use. Use realistic costs.
Strategy add on block
Strategy notice
Orders are simulated by the TradingView engine on standard candles. No request.security() calls are used.
Entries and exits
• Entry logic. Enter long when both the normalized flux and its guide line are above zero. Enter short when both are below zero
• Exit logic. When polarity flips from plus to minus, close any long and open a short. When the flux crosses above the guide line, close any short
• Risk model. No initial stop or target in v1.0. The model is a regime flipper. You can add a stop or trail in later versions if needed
• Tie handling. Not applicable in this version because there are no fixed stops or targets
Position sizing
• Percent of equity in the Properties panel. Five percent is the default for examples. Risk per trade should not exceed five to ten percent of equity. One to two percent is a common choice
Properties used on the published chart
• Initial capital 25000
• Base currency Default
• Default order size percent of equity with value 5
• Pyramiding 1
• Commission 0.05 percent
• Slippage 10 ticks
• Process orders on close ON
• Bar magnifier ON
• Recalculate after order is filled OFF
• Calc on every tick OFF
Dataset and sample size
• Test window Jan 2, 2014 to Oct 16, 2025 on QQQ one hour
• Trade count in sample 324 on the example chart
Release notes template for future updates
Version 1.1.
• Add alertcondition lines for long, short, and exit short
• Add optional table with component readouts
• Add optional stop model with a distance unit expressed as ATR or a percent of price
Notes. Backward compatibility Yes. Inputs migrated Yes.

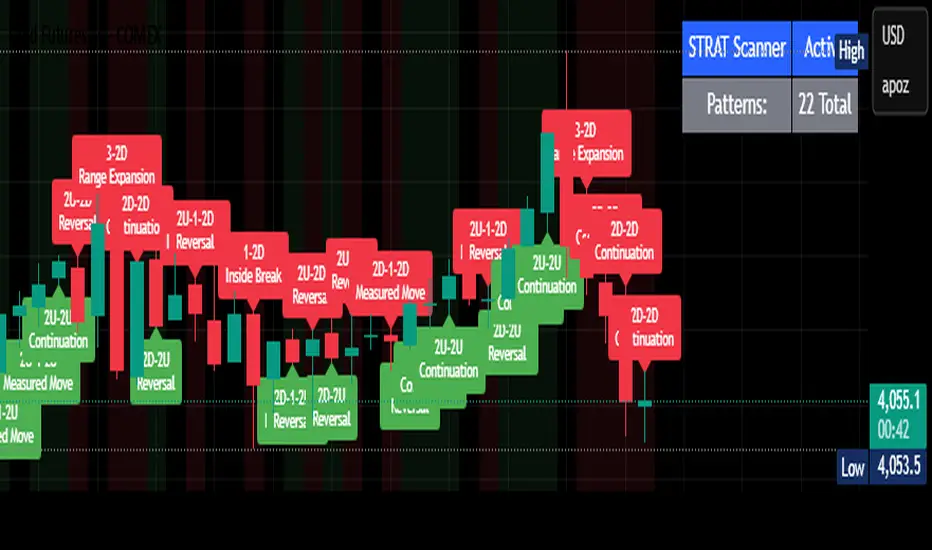
STRAT Pattern Scanner - All 22 PatternsSTRAT Candle call outs. A learning tool created to help me identify different STRAT candle types while learning The STRAT strategy designed by the late Rob Smith. Feel free to change the code or add to it for personalized use.
Bitcoin Halving Strategy
A systematic, data-driven trading strategy based on Bitcoin's 4-year halving cycles. This strategy capitalizes on historical price patterns that emerge around halving events, providing clear entry and exit signals for both accumulation and profit-taking phases.
🎯 Strategy Overview
This automated trading system identifies optimal buy and sell zones based on the predictable Bitcoin halving cycle that occurs approximately every 4 years. By analyzing historical data from all previous halvings (2012, 2016, 2020, 2024), the strategy pinpoints high-probability trading opportunities.
📊 Key Features
Automated Signal Generation: Buy signals at halving events and DCA zones, sell signals at profit-taking peaks
Multi-Phase Analysis: Tracks Accumulation, Profit Taking, Bear Market, and DCA phases
Visual Dashboard: Real-time performance metrics, phase countdown, and position tracking
Backtesting Enabled: Comprehensive historical performance analysis with configurable parameters
Risk Management: Built-in position sizing, slippage control, and optional short trading
⚙️ Strategy Logic
Buy Signals:
At halving event (Week 0)
DCA zone entry (Week 135 post-halving)
Sell Signals:
Profit-taking zone (Week 80 post-halving)
Optional short position entry for advanced traders
📈 Performance Highlights
Captures major bull run profits while avoiding prolonged bear markets
Clear visual indicators for all phases and transitions
Customizable timing parameters for personalized risk tolerance
Professional dashboard with live P&L, win rate, and drawdown metrics
🛠️ Customization Options
Adjustable phase timing (profit start/end, DCA timing)
Position sizing control
Enable/disable short trading
Visual customization (colors, labels, zones)
Table positioning and transparency
⚠️ Risk Disclosure
Past performance does not guarantee future results. This strategy is based on historical halving cycle patterns and should be used as part of a comprehensive trading plan. Always conduct your own research and consider your risk tolerance before trading.
💡 Ideal For
Long-term Bitcoin investors seeking systematic entry/exit points
Swing traders capitalizing on multi-month trends
Portfolio managers implementing cycle-based allocation strategies

RSI Momentum ScalperOverview
The "RSI Momentum Scalper" is a Pine Script v5 strategy crafted for trading highly volatile markets, with a special focus on newly listed cryptocurrencies. This strategy harnesses the Relative Strength Index (RSI) alongside volume analysis and momentum thresholds to pinpoint short-term trading opportunities. It supports both long and short trades, managed with customizable take profit, stop loss, and trailing stop levels, which are visually plotted on the chart for easy tracking.
Why I Created This Strategy
I developed the "RSI Momentum Scalper" because I was seeking a reliable trading strategy tailored to newly listed, highly volatile cryptocurrencies. These assets often experience rapid price fluctuations, rendering traditional strategies less effective. I aimed to create a tool that could exploit momentum and volume spikes while managing risk through adaptable exit parameters. This strategy is designed to address that need, offering a flexible approach for traders in dynamic crypto markets.
How It Works
The strategy utilizes RSI to identify momentum shifts, combined with volume confirmation, to trigger long or short entries. Trades are controlled with take profit, stop loss, and trailing stop levels, which adjust dynamically as the price moves in your favor. The trailing stop helps lock in profits, while the plotted exit levels provide clear visual cues for trade management.
Customizable Settings
The script is highly customizable, allowing you to adjust it to various market conditions and trading styles. Here’s a brief overview of the key settings:
Trade Mode: Select "Both," "Long Only," or "Short Only" to determine the trade direction.
(Default: Both)
RSI Length: Sets the lookback period for the RSI calculation (2 to 30).
(Default: 8)
A shorter length increases RSI sensitivity, suitable for volatile assets.
RSI Overbought: Defines the upper RSI threshold (60 to 99) for short entries.
(Default: 90)
Higher values signal stronger overbought conditions.
RSI Oversold: Defines the lower RSI threshold (1 to 40) for long entries.
(Default: 10)
Lower values indicate stronger oversold conditions.
RSI Momentum Threshold: Sets the minimum RSI momentum change (1 to 15) to trigger entries.
(Default: 14)
Adjusts the sensitivity to price momentum.
Volume Multiplier: Multiplies the volume moving average to filter high-volume bars (1.0 to 3.0).
(Default: 1)
Higher values require stronger volume confirmation.
Volume MA Length: Sets the lookback period for the volume moving average (5 to 50).
(Default: 13)
Influences the volume trend sensitivity.
Take Profit %: Sets the profit target as a percentage of the entry price (0.1 to 10.0).
(Default: 4.15)
Determines when to close a winning trade.
Stop Loss %: Sets the loss limit as a percentage of the entry price (0.1 to 6.0).
(Default: 1.85)
Protects against significant losses.
Trailing Stop %: Sets the trailing stop distance as a percentage (0.1 to 4.0).
(Default: 2.55)
Locks in profits as the price moves favorably.
Visual Features
Exit Levels: Take profit (green), fixed stop loss (red), and trailing stop (orange) levels are plotted when in a position.
Performance Table: Displays win rate, total trades, and net profit in the top-right corner.
How to Use
Add the strategy to your chart in TradingView.
Adjust the input settings based on the cryptocurrency and timeframe you’re trading.
Monitor the plotted exit levels for trade management.
Use the performance table to assess the strategy’s performance over time.
Notes
Test the strategy on a demo account or with historical data before live trading.
The strategy is optimized for short-term scalping; adjust settings for longer timeframes if needed.

Order Block Volumatic FVG StrategyInspired by: Volumatic Fair Value Gaps —
License: CC BY-NC-SA 4.0 (Creative Commons Attribution–NonCommercial–ShareAlike).
This script is a non-commercial derivative work that credits the original author and keeps the same license.
What this strategy does
This turns BigBeluga’s visual FVG concept into an entry/exit strategy. It scans bullish and bearish FVG boxes, measures how deep price has mitigated into a box (as a percentage), and opens a long/short when your mitigation threshold and filters are satisfied. Risk is managed with a fixed Stop Loss % and a Trailing Stop that activates only after a user-defined profit trigger.
Additions vs. the original indicator
✅ Strategy entries based on % mitigation into FVGs (long/short).
✅ Lower-TF volume split using upticks/downticks; fallback if LTF data is missing (distributes prior bar volume by close’s position in its H–L range) to avoid NaN/0.
✅ Per-FVG total volume filter (min/max) so you can skip weak boxes.
✅ Age filter (min bars since the FVG was created) to avoid fresh/immature boxes.
✅ Bull% / Bear% share filter (the 46%/53% numbers you see inside each FVG).
✅ Optional candle confirmation and cooldown between trades.
✅ Risk management: fixed SL % + Trailing Stop with a profit trigger (doesn’t trail until your trigger is reached).
✅ Pine v6 safety: no unsupported args, no indexof/clamp/when, reverse-index deletes, guards against zero/NaN.
How a trade is decided (logic overview)
Detect FVGs (same rules as the original visual logic).
For each FVG currently intersected by the bar, compute:
Mitigation % (how deep price has entered the box).
Bull%/Bear% split (internal volume share).
Total volume (printed on the box) from LTF aggregation or fallback.
Age (bars) since the box was created.
Apply your filters:
Mitigation ≥ Long/Short threshold.
Volume between your min and max (if enabled).
Age ≥ min bars (if enabled).
Bull% / Bear% within your limits (if enabled).
(Optional) the current candle must be in trade direction (confirm).
If multiple FVGs qualify on the same bar, the strategy uses the most recent one.
Enter long/short (no pyramiding).
Exit with:
Fixed Stop Loss %, and
Trailing Stop that only starts after price reaches your profit trigger %.
Input settings (quick guide)
Mitigation source: close or high/low. Use high/low for intrabar touches; close is stricter.
Mitigation % thresholds: minimal mitigation for Long and Short.
TOTAL Volume filter: skip FVGs with too little/too much total volume (per box).
Bull/Bear share filter: require, e.g., Long only if Bull% ≥ 50; avoid Short when Bull% is high (Short Bull% max).
Age filter (bars): e.g., ≥ 20–30 bars to avoid fresh boxes.
Confirm candle: require candle direction to match the trade.
Cooldown (bars): minimum bars between entries.
Risk:
Stop Loss % (fixed from entry price).
Activate trailing at +% profit (the trigger).
Trailing distance % (the trailing gap once active).
Lower-TF aggregation:
Auto: TF/Divisor → picks 1/3/5m automatically.
Fixed: choose 1/3/5/15m explicitly.
If LTF can’t be fetched, fallback allocates prior bar’s volume by its close position in the bar’s H–L.
Suggested starting presets (you should optimize per market)
Mitigation: 60–80% for both Long/Short.
Bull/Bear share:
Long: Bull% ≥ 50–70, Bear% ≤ 100.
Short: Bull% ≤ 60 (avoid shorting into strong support), Bear% ≥ 0–70 as you prefer.
Age: ≥ 20–30 bars.
Volume: pick a min that filters noise for your symbol/timeframe.
Risk: SL 4–6%, trailing trigger 1–2%, distance 1–2% (crypto example).
Set slippage/fees in Strategy Properties.
Notes, limitations & best practices
Data differences: The LTF split uses request.security_lower_tf. If the exchange/data feed has sparse LTF data, the fallback kicks in (it’s deliberate to avoid NaNs but is a heuristic).
Real-time vs backtest: The current bar can update until close; results on historical bars use closed data. Use “Bar Replay” to understand intrabar effects.
No pyramiding: Only one position at a time. Modify pyramiding in the header if you need scaling.
Assets: For spot/crypto, TradingView “volume” is exchange volume; in some markets it may be tick volume—interpret filters accordingly.
Risk disclosure: Past performance ≠ future results. Use appropriate position sizing and risk controls; this is not financial advice.
Credits
Visual FVG concept and original implementation: BigBeluga.
This derivative strategy adds entry/exit logic, volume/age/share filters, robust LTF handling, and risk management while preserving the original spirit.
License remains CC BY-NC-SA 4.0 (non-commercial, attribution required, share-alike).

StratNinjaTable - VerticalA Pine Script v6 indicator that displays a vertical table with key The Strat data and supporting metrics.
✦ Table Structure:
Overview:
Ticker – the stock symbol.
TF – the chart’s main timeframe.
MFI – Money Flow Index with selectable timeframe.
ATR – Average True Range with color coding:
Green – below 3%.
Yellow – between 3% and 6%.
Red – above 6%.
Timeframes:
Displayed vertically (5m, 15m, 1H, D, W, M, etc.).
Each shows the current bar type according to The Strat (1, 2U, 2D, 3).
Text color reflects candle direction (green = close above open, red = close below open).
Includes a countdown timer to bar close.
Fundamentals:
Market Cap – in billions.
Sector – stock sector.
SMA20 Δ – distance from the 20-period SMA (in %).
Avg Volume (30d) – average 30-day volume (in millions).
✦ Adjustments Made:
Removed the Strat Pattern section completely.
Removed the DIR column – direction is now represented by Strat cell text color.
Reordered Overview section: Ticker → TF → MFI → ATR.
ATR now has three levels of coloring (Green/Yellow/Red) for >3% and >6%
The Maker StrategyDESCRIPTION
The Maker Strategy is a trend-following system built around exponential moving averages (EMAs). By analyzing the alignment of multiple EMAs, the strategy identifies strong bullish or bearish momentum and generates precise entry signals. This method is designed to capture sustained trends while filtering out sideways or noisy market conditions.
USER INPUTS :
• EMA 1 Length (Default: 30)
• EMA 2 Length (Default: 35)
• EMA 3 Length (Default: 40)
• EMA 4 Length (Default: 45)
• EMA 5 Length (Default: 50)
• EMA 6 Length (Default: 60)
LONG CONDITION :
A long signal is triggered when all EMAs are perfectly aligned in ascending order:
EMA1 > EMA2 > EMA3 > EMA4 > EMA5 > EMA6
SHORT CONDITION :
A short signal is triggered when all EMAs are perfectly aligned in descending order:
EMA1 < EMA2 < EMA3 < EMA4 < EMA5 < EMA6
WHY IT IS UNIQUE:
Unlike traditional EMA crossover systems that rely on just 2 or 3 moving averages, The Maker Strategy uses 6 EMAs in sequence. This ensures that trades are only taken when there is clear and strong market momentum. The approach minimizes false signals in ranging markets and focuses on capturing trends with higher probability setups.
HOW USER CAN BENEFIT FROM IT :
• Clear entry alerts for both long and short positions.
• Visual confirmation through candle coloring and EMA band fills.
• Works on multiple timeframes and instruments (stocks, forex, crypto, indices).
• Helps traders stay on the right side of the trend while avoiding whipsaws.
• A simple yet effective tool for those who want a disciplined, rules-based strategy.

RSI Momentum Trend MM with Risk Per Trade [MTF]This is a comprehensive and highly customizable trend-following strategy based on RSI momentum. The core logic identifies strong directional moves when the RSI crosses user-defined thresholds, combined with an EMA trend confirmation. It is designed for traders who want granular control over their strategy's parameters, from signal generation to risk management and exit logic.
This script evolves a simple concept into a powerful backtesting tool, allowing you to test various money management and trade management theories across different timeframes.
Key Features
- RSI Momentum Signals: Uses RSI crosses above a "Positive" level or below a "Negative" level to generate trend signals. An EMA filter ensures entries align with the immediate trend.
- Multi-Timeframe (MTF) Analysis: The core RSI and EMA signals can be calculated on a higher timeframe (e.g., using 4H signals to trade on a 1H chart) to align trades with the larger trend. This feature helps to reduce noise and improve signal quality.
Advanced Money Management
- Risk per Trade %: Calculate position size based on a fixed percentage of equity you want to risk per trade.
- Full Equity: A more aggressive option to open each position with 100% of the available strategy equity.
Flexible Exit Logic: Choose from three distinct exit strategies to match your trading style
- Percentage (%) Based: Set a fixed Stop Loss and Take Profit as a percentage of the entry price.
- ATR Multiplier: Base your Stop Loss and Take Profit on the Average True Range (ATR), making your exits adaptive to market volatility.
- Trend Reversal: A true trend-following mode. A long position is held until an opposite "Negative" signal appears, and a short position is held until a "Positive" signal appears. This allows you to "let your winners run."
Backtest Date Range Filter: Easily configure a start and end date to backtest the strategy's performance during specific market periods (e.g., bull markets, bear markets, or high-volatility periods).
How to Use
RSI Settings
- Higher Timeframe: Set the timeframe for signal calculation. This must be higher than your chart's timeframe.
- RSI Length, Positive above, Negative below: Configure the core parameters for the RSI signals.
Money Management
Position Sizing Mode
- Choose "Risk per Trade" to use the Risk per Trade (%) input for precise risk control.
- Choose "Full Equity" to use 100% of your capital for each trade.
- Risk per Trade (%): Define the percentage of your equity to risk on a single trade (only works with the corresponding sizing mode).
SL/TP Calculation Mode
Select your preferred exit method from the dropdown. The strategy will automatically use the relevant inputs (e.g., % values, ATR Multiplier values, or the trend reversal logic).
Backtest Period Settings
Use the Start Date and End Date inputs to isolate a specific period for your backtest analysis.
License & Disclaimer
© waranyu.trkm — MIT License.
This script is for educational purposes only and should not be considered financial advice. Trading involves significant risk, and past performance is not indicative of future results. Always conduct your own research and risk assessment before making any trading decisions.

BE-Fib Channel 2 Sided Trading█ Overview:
"BE-Fib Channel 2 Sided Trading" indicator is built with the thought of 2 profound setups named "Cup & Handle (C&H)" and "Fibonacci Channel Trading (FCT)" with the context of "day trading" or with a minimum holding period.
█ Similarities, Day Trading Context & Error Patterns:
While the known fact is that both C&H and FCT provide setups with lesser risk with bigger returns, they both share the similar "Base Pattern".
Note: Inverse of the above Image shall switch the setups between long vs short.
Since the indicator is designed for smaller time-frame candles, there may be instances where the "base pattern" does not visually resemble a Cup & Handle (C&H) pattern. However, patterns are validated using pivot points. The points labeled "A" and "C" can be equal or slightly slanted. Settings of the Indicator allows traders a flexibility to control the angle of these points to spot the strategies according to set conditions. Therefore, understanding the nuances of these patterns is crucial for effective decision-making.
█ 2 Sided Edge: FCT suggests to take trade closer to the yellow line to get better RR ratio. this leaves a small chance of doubt as to; what if price is intended to break the Yellow line thereby activating the C&H.
Wait for the confirmation is a Big FOMO with a compromised RR.
Hence, This indicator is designed to handle both the patterns based on the strength, FIFO and pattern occurring delay.
█ How to Use this Indicator:
Step 1: Enable the Show Sample Sensitivity option to understand the angle of yellow line shown in the sample image. By enabling this option, On the last bar you shall see 4 lines being plotted depicting the max angle which is acceptable for both long and short trades.
Note: Angle can be controlled via setting "Sensitivity".
Higher Sensitivity --> Higher Setup identification --> can lead to failed setups due to 2 sided trading.
Lower Sensitivity --> Lower Setup identification --> can increase the changes of being right.
Step 2: Adjust the look back & look forward periods which shall be used for identifying patterns.
Note: Smaller values can lead to more setups being identified but can hamper the performance of the indicator while increasing the chances of failures. larger values identifies more significant setup but leads to more waiting period thereby compromising on the RR.
Step 3: Adjust the Base Range.
Note: Smaller values can lead to more setups being identified but can hamper the performance of the indicator while increasing the chances of failures. larger values identifies more significant setup but leads to more Risk on play.
Step 4: set the Entry level for FCT & Set the SL for Both FCT & C&H and Target Reward ratio for C&H.
█ Features of Indicator & How it works:
1. Patterns are being identified using Pivot Points method.
2. Tracks & validates both the setups simultaneously on every candle and traded one at a time based on FIFO, New setups found in-between, Defined Entry Levels while on wait for the other pattern to get activated.
3. Alerts added for trade events.
4. FCT setups are generally traded with trailed SL level and increasing Target level on every completed bar. while C&H has the standard SL & TP level with no Trail SL option.
DISCLAIMER: No sharing, copying, reselling, modifying, or any other forms of use are authorized for our documents, script / strategy, and the information published with them. This informational planning script / strategy is strictly for individual use and educational purposes only. This is not financial or investment advice. Investments are always made at your own risk and are based on your personal judgement. I am not responsible for any losses you may incur. Please invest wisely.
Happy to receive suggestions and feedback in order to improve the performance of the indicator better.
